The XY Graph...YOU MUST GET THIS

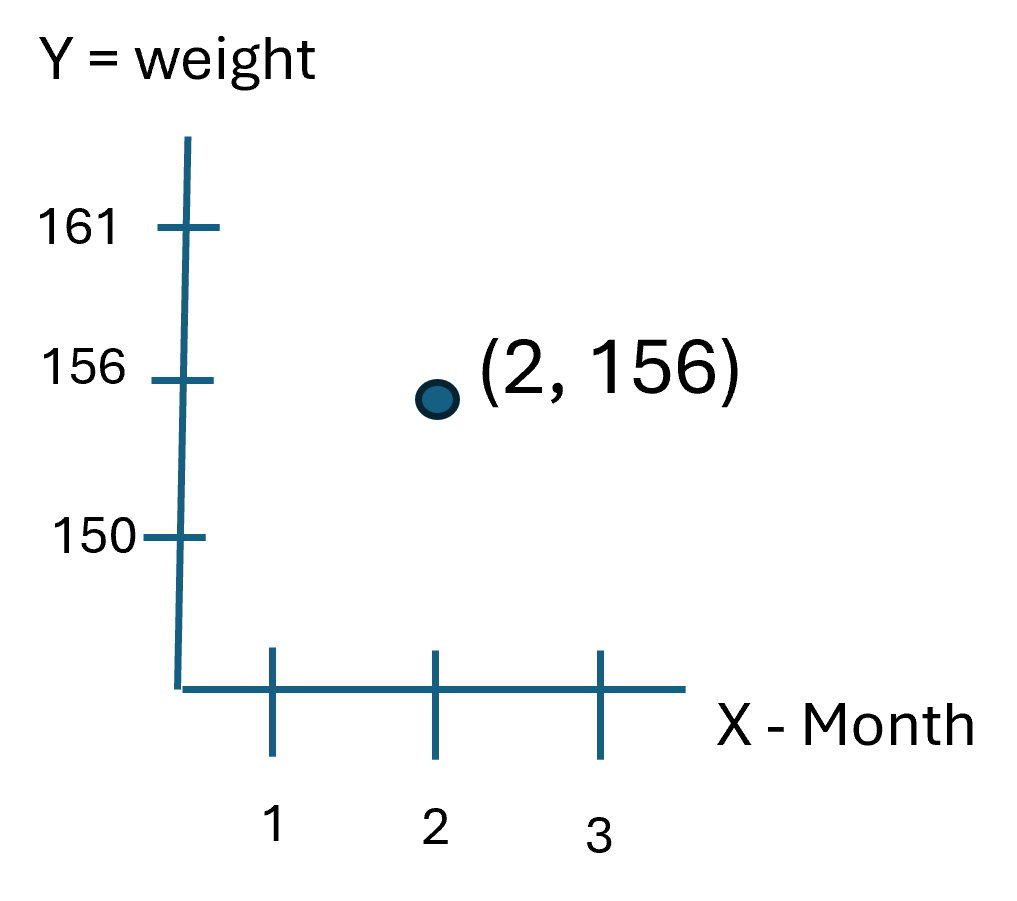
So much of algebra comes down to understanding the xy graph. It's like tracking a car, for example. At some point the GPS says the car is at one point (latitude, longitude) and at another time it's at another point. Think of the xy as a representation of points in space/time. Imagine that you're tracking your weight over 3 months. The below graph shows 3 months (1,2,3). Assume at month 2 you weighed 156 lbs. The x,y graph would show the point below. The point represents the intersection of month 2 (x value) and your weight (y value) of 156.
What's Your Reaction?